HOW
TO COMMENT ABOUT A VISUAL AID
Choosing
the right visual aid
A pie chart displays the size of each part as a percentage of a whole.


More Information
Print the documents
before doing the activities
Activities
|
HOW
TO COMMENT ABOUT A VISUAL AID
|
|||
|
Choosing
the right visual aid
|
|||
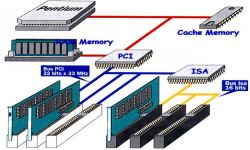
| A flow chart is a diagram showing the progress of material through the steps of a manufacturing process or the succession of operations in a complex activity. |
A pie chart displays the size of each part as a percentage of a whole. |
A (vertical or horizontal) bar chart is used to compare unlike items. | |
|
|
|
|
|
| A line chart depicts changes over a period of time, showing data and trends. | A table is a convenient way to show a large amount of data in a small space. | A diagram is a drawing showing arrangements and situations, such as networks, distribution, fluctuation ... | |
|
|
|
|
|
More Information |
Print the documents before doing the activities |
Activities |
|
| . | . | ||